What is a discourse graph
Discourse Graphs are an information model that emphasizes discourse moves (such as questions, claims, and evidence), and relations (such as support or opposition) as the main units of a body of knowledge.
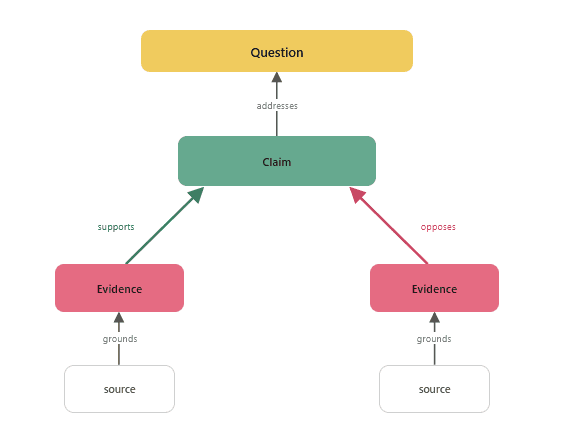 The basic parts of a discourse graph: questions, claims, and evidence
-
A Question is the unknown that we wish to make known, the motivation for the research project.
-
A Claim is a singular, generalized assertion that addresses the Question.
-
Evidence is a specific empirical observation from a particular application of a research method that supports or opposes particular Claims.
-
A Source is a research artefact that contains Evidence (but can also be attached to provenance Questions or Claims): an experiment, article, simulation, etc.
Below is an image of discourse graph investigating a question from the metascience literature: “Is citation count a hopelessly confounded metric?”
The question is attributed to its ultimate source, a 1968 paper by Robert K. Merton that christened the phenomenon of cumulative advantage as the “Matthew Effect.” As you can see it also references claims and evidence from more recent work produced in conversation with Merton’s seminal paper. The author of this graph is curating the most interesting claims and strongest evidence from each of these sources as a predicate for their own original research contributions on the topic.
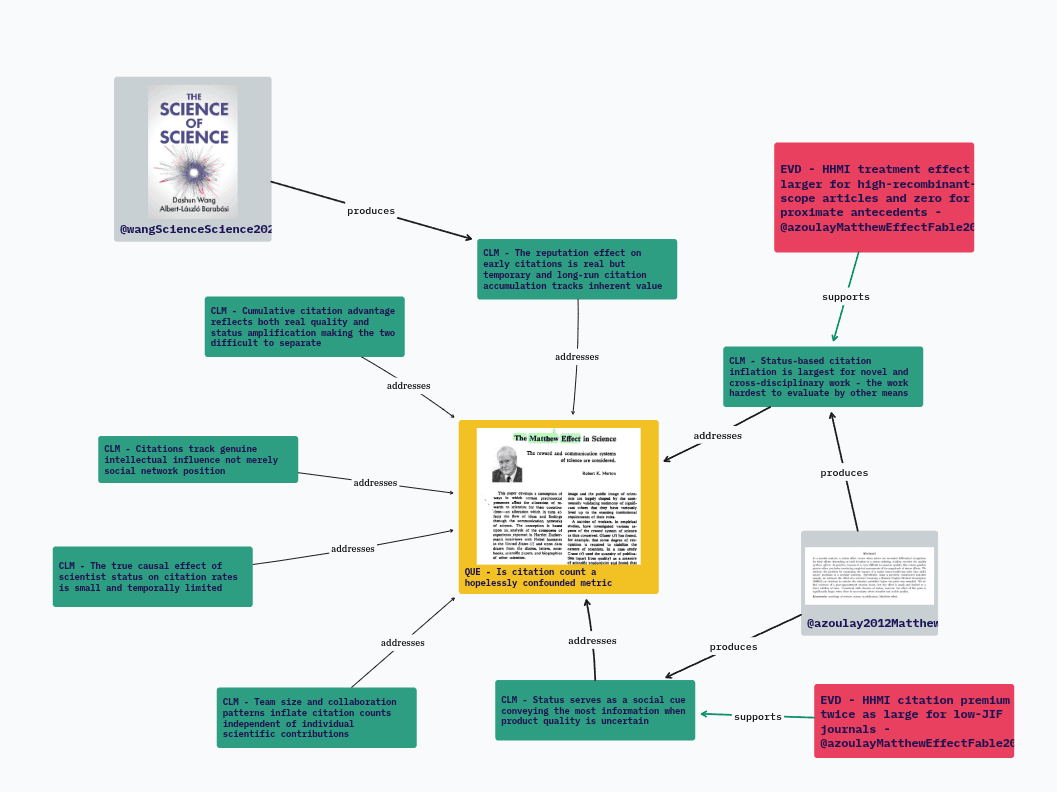 A discourse graph from a literature synthesis. Note how each evidence node is tightly integrated with its source for ease of provenancing
Why use a discourse graph?
The discourse graph workflow supports reasoning and retrieval based on the discourse units that are central to scientific conversation and discovery: questions, claims, and evidence — and the relationships between them. The discourse graph posits that the document is not usually the unit of interest in a research workflow, but rather a container for discourse nodes and edges that inform your research question.
The discourse graph conceptual schema accommodates the lifecycle and components of a research project, from ideation to experiment planning, to analysis. It facilitates dissemination of these nodes and relations at any stage of the process.
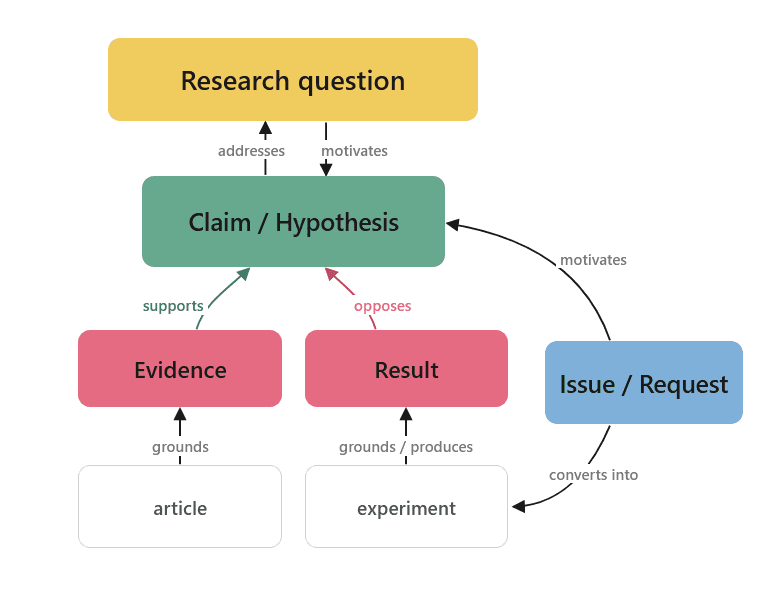 The discourse graph conceptual schema includes node equivalents named to fit literature synthesis and experimental workflows
Learn more about the discourse graph schema here
Below we sketch three examples of how a researcher might use a discourse graph in their work:
Understanding a problem
Preparatory literature synthesis
The researcher assembling the discourse graph above is mapping out a problem space in preparation for making an original research contribution, curating the most interesting claims and strongest evidence related to his or her original research question.
Formulating a research contribution
The form of the discourse graph makes it easier to spot weak links and gaps in the evidentiary support network undergirding a claim. This analysis can be applied to existing bodies of literature as well as to assessing whether a current research project has made a sufficient contribution.
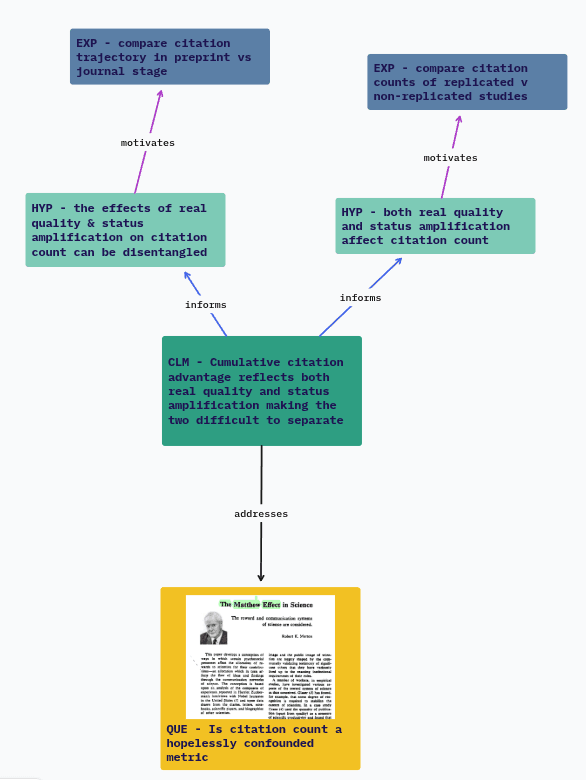 Formulating experiments to test a claim from the literature
Constructing a theory
Discourse graphs can be used to visually assess the structure of a theory or model: are the edges well-positioned? Sufficiently evidenced? Necessary?
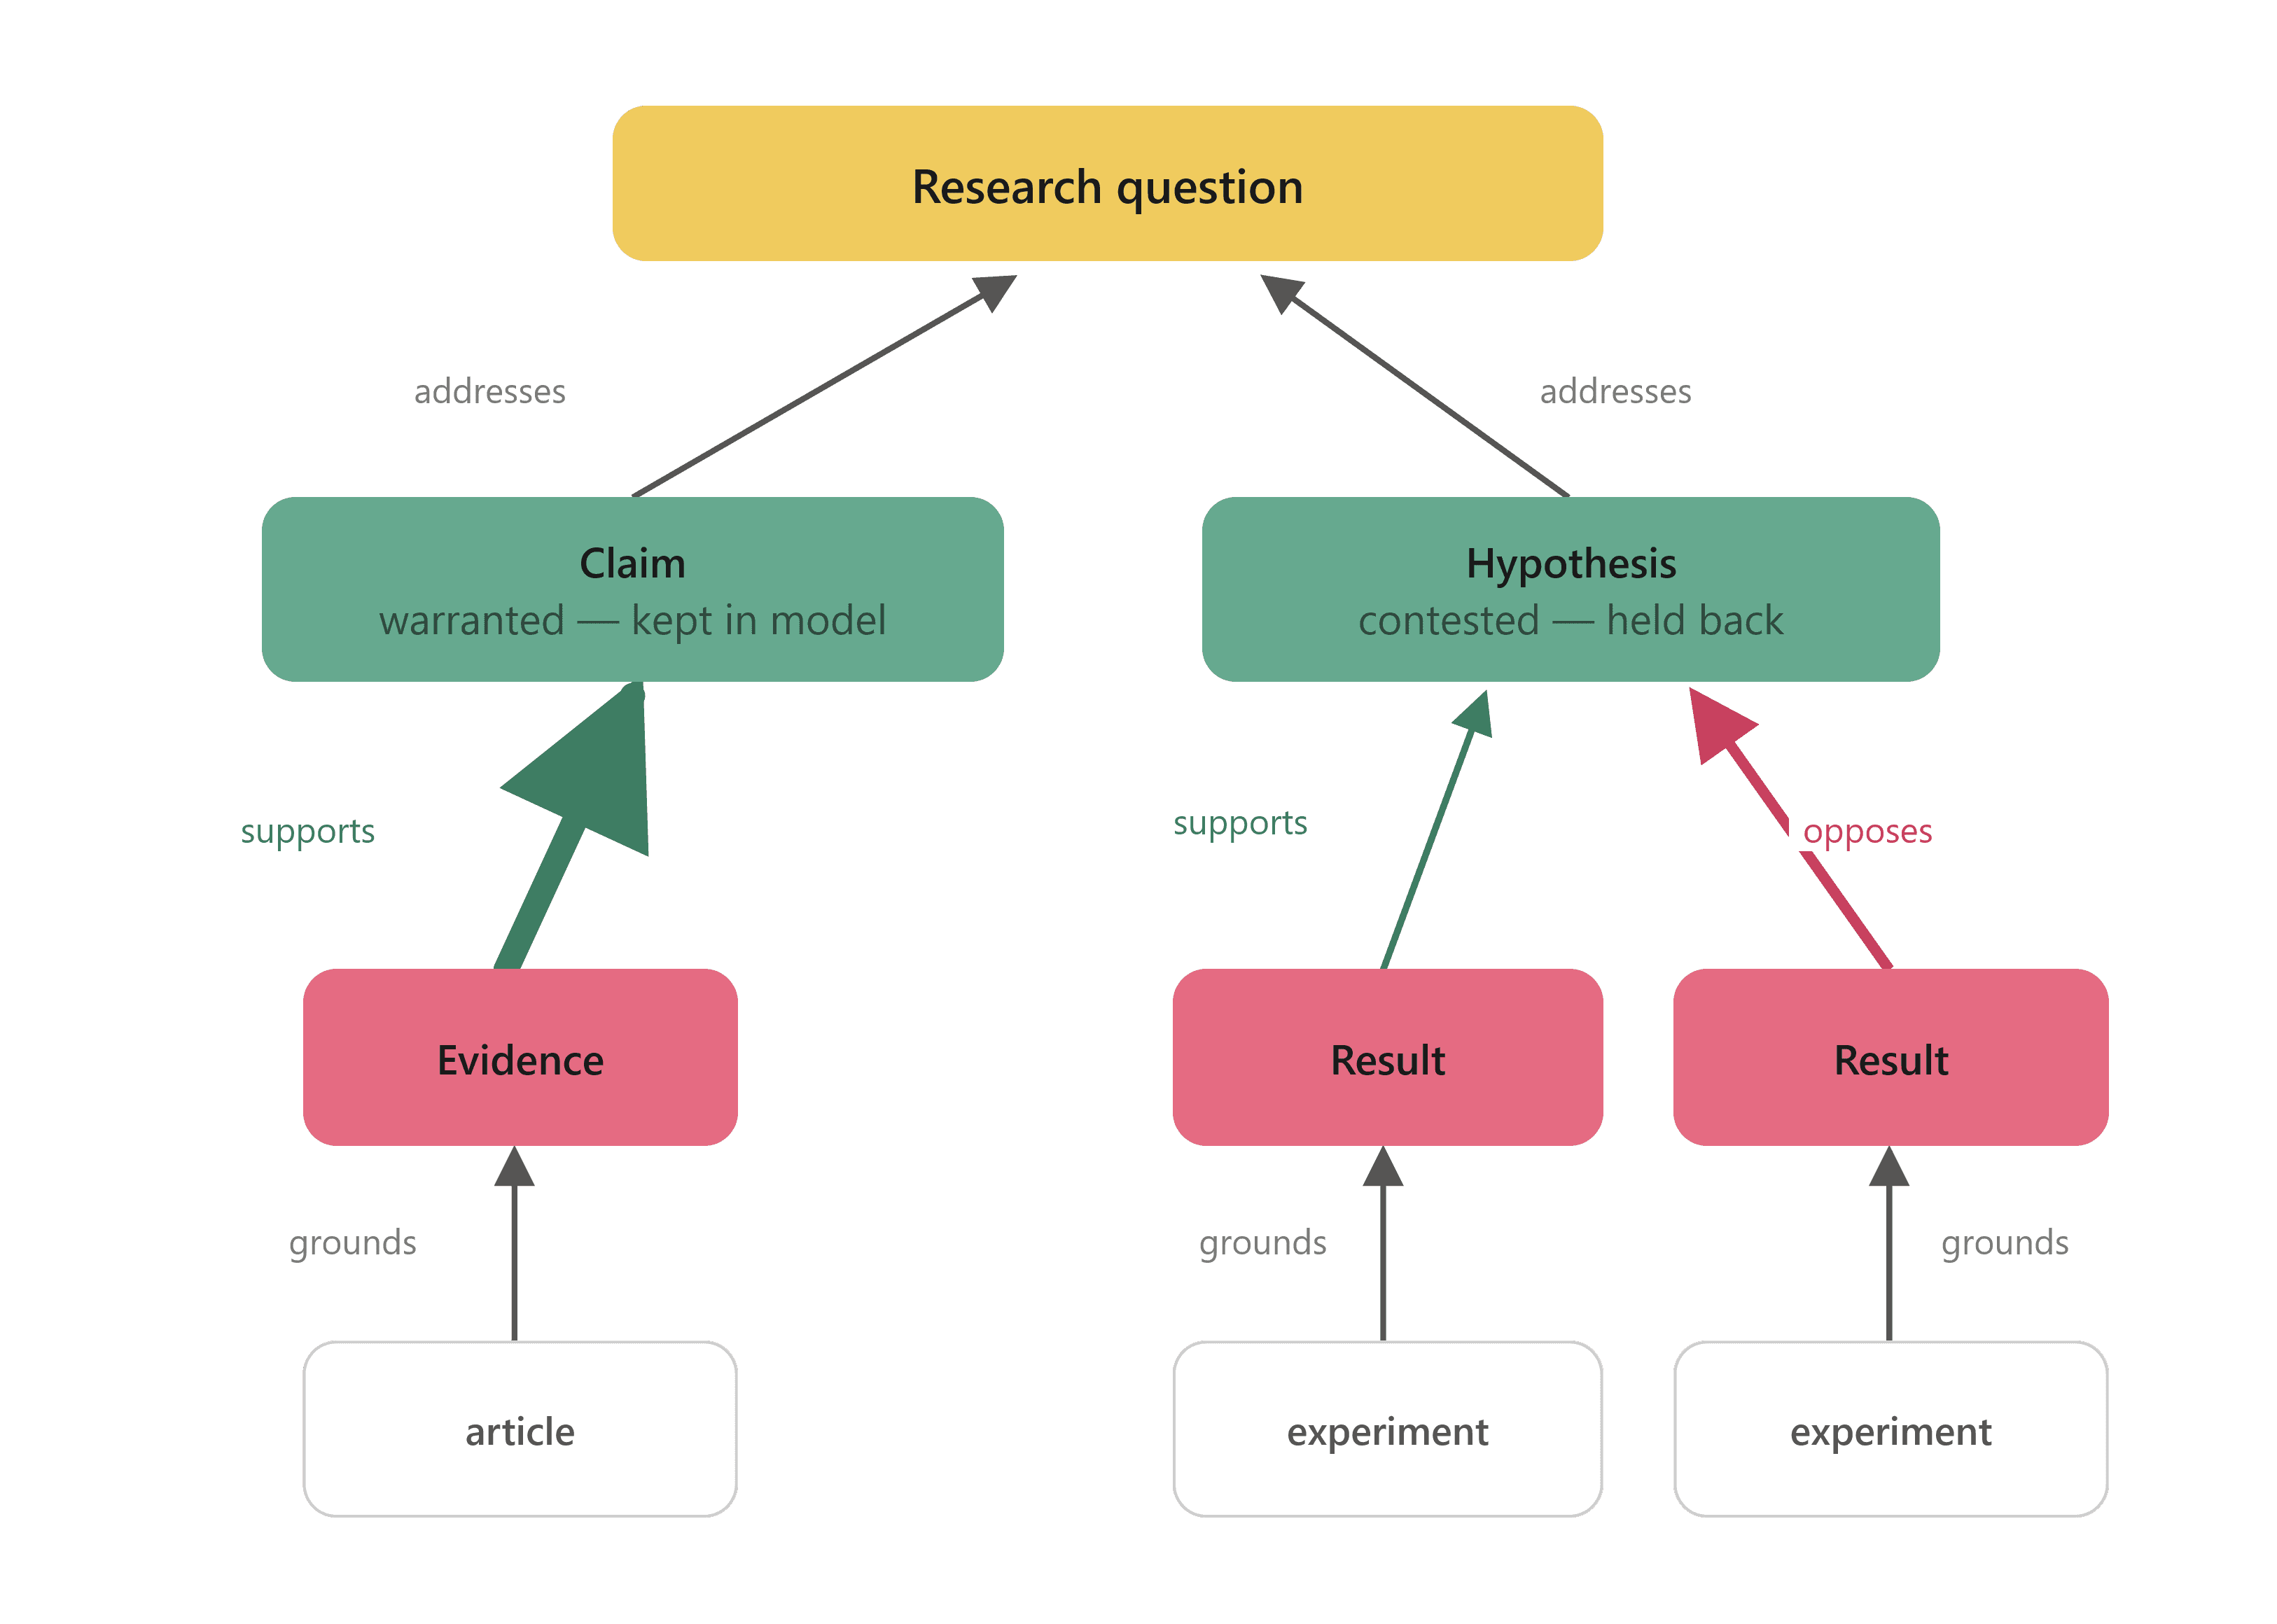 Testing edge weights of a model
In all of these examples, the researcher is focusing on discourse units (questions, claims, and evidence) and evaluating them in relation to his or her particular research question rather than remaining constrained by the research questions motivating the papers (sources) from which the claims and evidence derive.
This information model foregrounds the conceptual building blocks and relationships that are important for synthesis, compared to a typical “iTunes for papers ” model that foregrounds documents in a way that forces us to drudge through tedious extraction work before we can do the thinking we want to do!
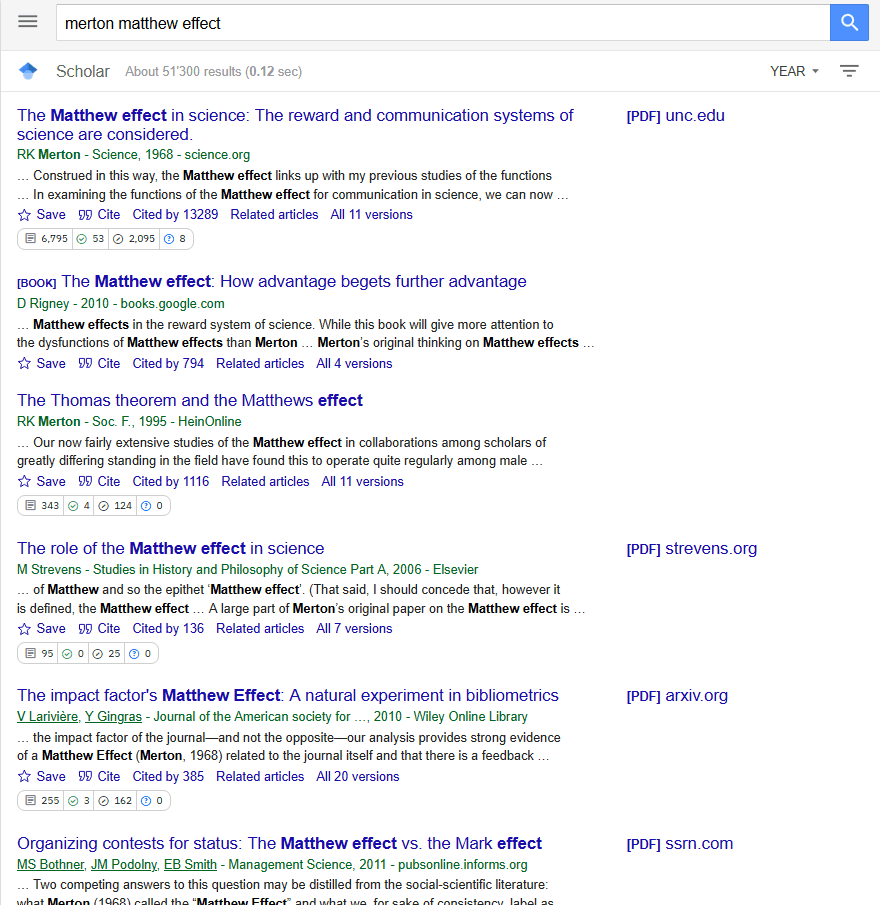 The discourse graph workflow recognizes that you don’t always play the full LP at the dance party
This information model has great potential for augmenting individual and collective “research-grade” synthesis (e.g. lit reviews for a dissertation or grant proposal).
Discourse Graphs are not a new idea (you can read more about it in this short (academic-focused) write-up or this more practically-oriented article ), but the potential to use it for everyday research work is!